


Cost of Production and Farm Policy, Part II: Statutory Reference Prices
This second of two articles on cost of production and farm policy (see farmdoc daily June 21, 2023) examines the increase in costs to produce program commodities since the 2014 farm bill established statutory reference prices. Costs per acre are higher now, but the percent increase in cost, whether measured per acre or per output unit, varies widely by crop, as does the relationship between cost and statutory reference price. Nevertheless, across the various measures, costs have consistently increased the most for oats and sorghum and the least for barley, rice, and peanuts.
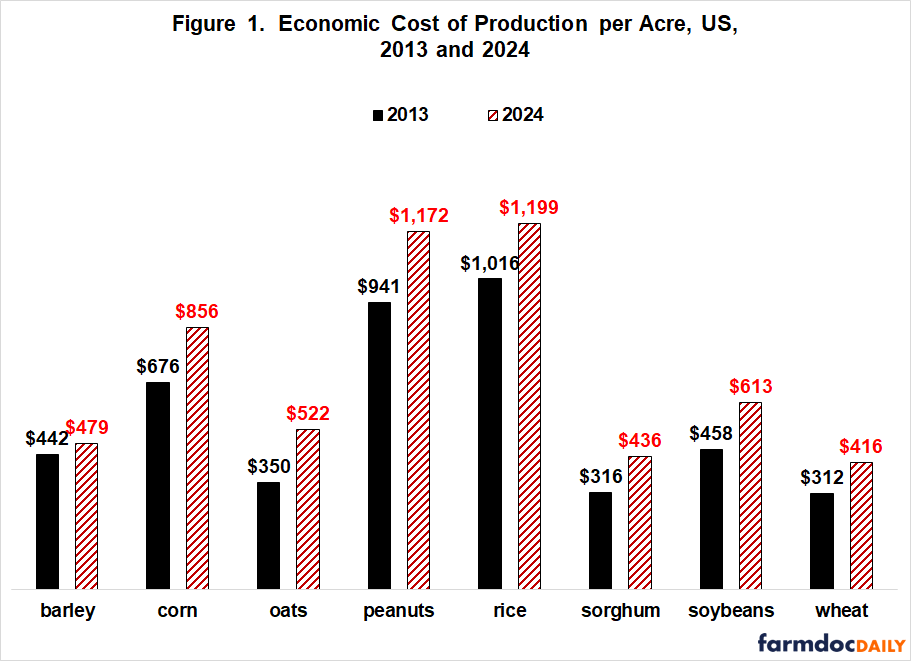
Economic Cost of Production per Acre, 2024 vs. 2013
Statutory reference prices date to the 2014 farm bill. The debate that formed the compromise that led to the 2014 farm bill reference prices spanned the 2013 crop year. Almost all of these statutory reference prices were reauthorized by the 2018 farm bill and remain in effect today. They will thus be the starting point for the new farm bill, which, if enacted will likely take effect with the 2024 crop year. Given this background, a reasonable analysis is to examine the change in cost of production from the 2013 to 2024 crop year. USDA, ERS (US Department of Agriculture, Economic Research Service) estimates an economic cost to produce barley, corn, cotton, oats, peanuts, rice, sorghum, soybeans, and wheat. They just released a forecast of the economic cost to produce the 2024 crops on June 22, 2023. The forecasted 2024 economic cost of production per acre exceeds the 2013 cost for all crops (see Figure 1). Data Note 1 contains a further discussion of the USDA, ERS cost measures. Note that seed cotton is not included in this study. It combines cottonseed and lint for program payment purposes, and its statutory reference price dates only to the 2018 crop year.
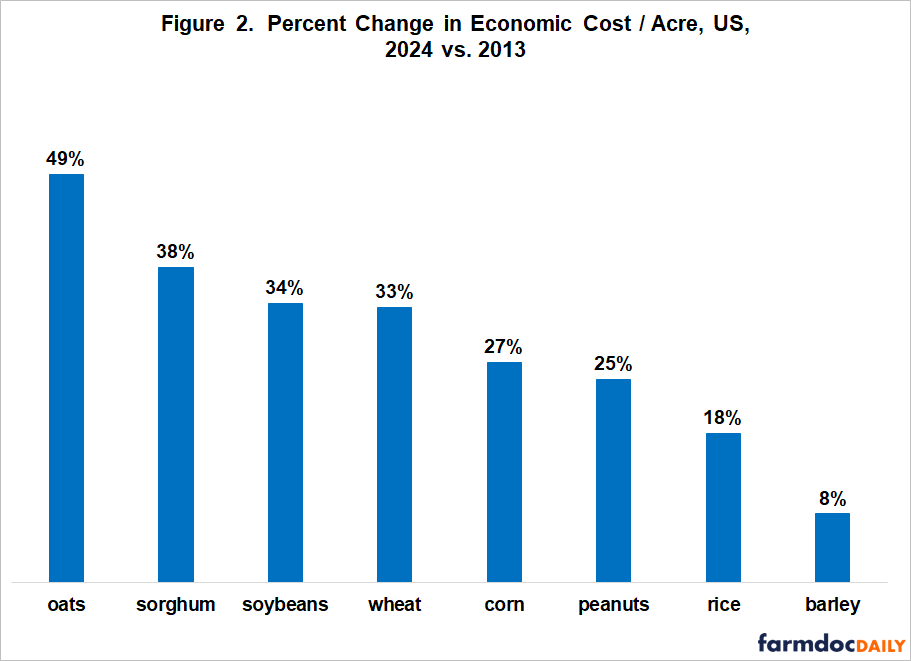
Percent Change in Economic Cost per Acre
Wide variation exists in how much cost has increased by crop. The largest percent increase exceeds the smallest increase by a factor of six: 49% higher for oats vs. 8% higher for barley (see Figure 2).
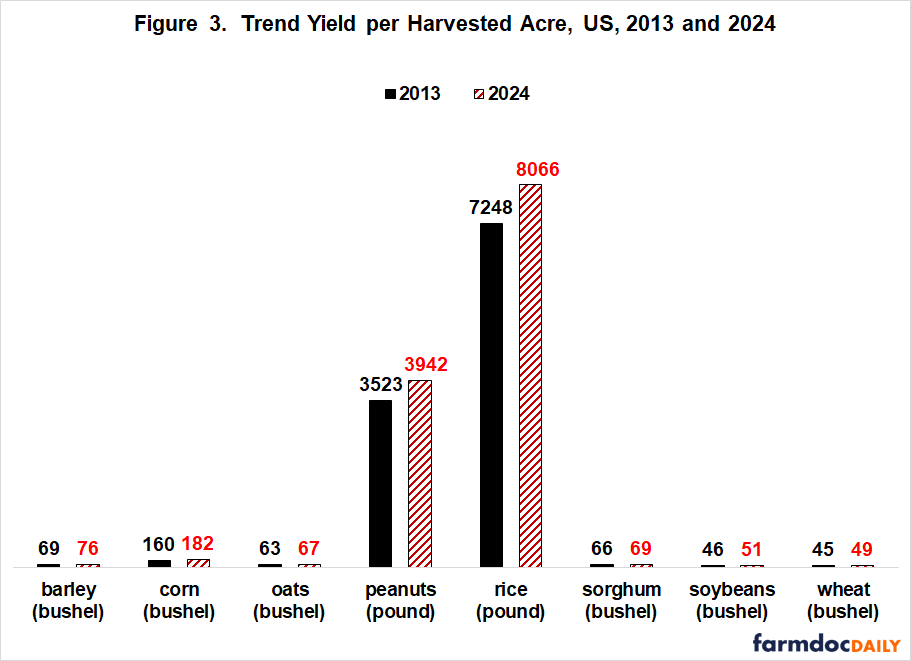
Economic Cost per Output Unit, 2024 vs. 2013
Economic costs per acre do not take into account changes in yield per acre. The economic cost to produce a unit of output was calculated by dividing the economic cost per acre by US trend yield for the 2013 and 2024 crop years. US trend yields were estimated using a linear trendline regression for the 1974/75 through 2022/23 crop years. This calculation is discussed further in Data Note 2. Compared with 2013, trend yield for 2024 is higher by 13% for corn, 12% for soybeans and peanuts, 11% for rice, 10% for barley, 9% for wheat, and 5% for sorghum and oats (see Figure 3). The impact of trend growth on economic cost per unit of output will be highest for corn, soybeans, and peanuts; and lowest for sorghum and oats.
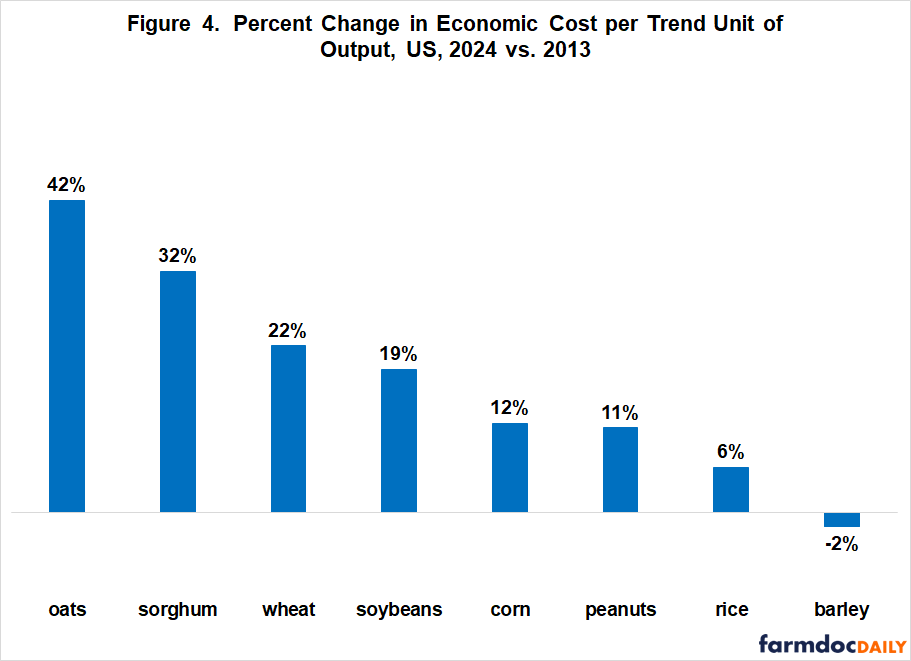
The increase in trend yield between 2013 and 2024 means that the percent change in economic cost between 2013 and 2024 will be smaller when measured per unit of trend output than when measured per acre (compare Figures 4 and 2). Of particular note, economic cost per unit of trend output was little changed for barley in 2024 vs. 2013 and up only single digit for rice (6%). Nevertheless, the rank order of crops is similar for both percent change measures. Percent increase in cost per acre and per output unit is highest for oats and sorghum and smallest for rice and barley.
Ratio of Economic Cost to Statutory Reference Price
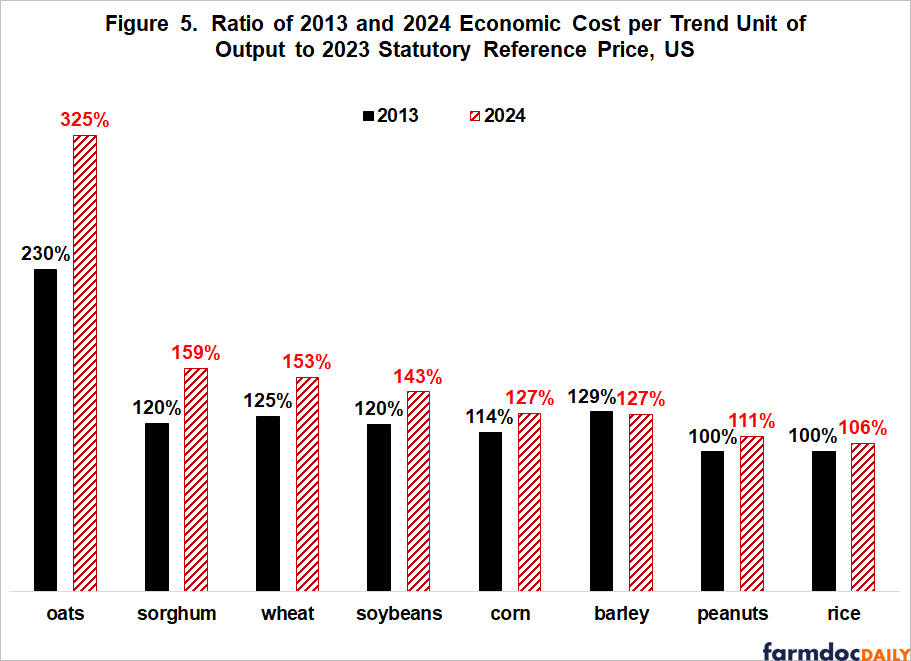
The higher the economic cost to produce a crop relative to the statutory reference price, the lower is the support provided by the reference price to the crop when a base acre of the crop is planted to the same crop. Oats had the highest ratio of economic cost per trend output unit to statutory reference in both 2024 and 2013, implying its reference price provides the least support to producing the crop. Peanuts and rice had the lowest ratios in both years, implying their reference price provides the most support to producing these crops on a base acre of the crop.
Between 2013 and 2024, the ratio increased the most for oats (325% vs. 230%), sorghum (159% vs. 120%), wheat (153% vs. 125%), and soybeans (143% vs. 120%). These four crops thus experienced the largest deterioration in support due to increases in the cost of production since statutory reference prices were established. Source for statutory reference prices is USDA, FSA (Farm Service Agency).
Discussion
Despite the decline in many crop input prices over the last six months, costs per acre to produce program crops are higher now than when statutory reference prices came into existence.
However, wide variation exists across program crops in the percent increase in cost per acre and cost per trend output unit, as well as in the relationship between cost and statutory reference price.
Nevertheless, across these different perspectives on change in costs since statutory reference prices were introduced, costs have consistently increased the most for oats and sorghum and increased the least for barley, rice, and peanuts.
It is not just changes in input prices and cost per acre that matter. Different growth rates in trend yield can impact changes in cost per output unit even over periods as short as the farm bill and its 10 year budgeting period. For example, oats and sorghum have the slowest rate of growth in yields, which contribute to them having the largest increase in cost per output unit since 2013 and the highest current ratio of cost per output unit to statutory reference price.
These findings have potential policy significance because relative changes often have as much, if not more, influence on adjustments to existing policy parameters than do changes in levels.
Data Notes
- USDA, ERS assigns a cost to all inputs except management. An opportunity cost is assigned to unpaid labor and farmer-owned land. Quantity of inputs is based on periodic surveys of farms. Input price is updated annually using USDA, NASS (National Agriculture Statistical Service) surveys. Our assessment is that ERS costs are a reasonable measure of the cost to produce a US crop, but we encourage readers to examine the extended discussion in Zulauf, Langemeier, and Schnitkey (2020) and form their own opinion.
- The yields used to estimate trend yields in this analysis are from the QuickStats data base maintained by USDA, NASS. US Trend yields were estimated for both harvested acres and planted acres. Because relative changes in these two yields are relatively similar over shorter periods, the findings are little impacted by which yield is use. Harvest yield is used because it is the more commonly used. A linear time trend variable explained the following share of year-to year variation in yield per harvested acre over the 1974-2022 crop years by crop: barley (80%); corn (86%), oats (54%), peanuts (70%), rice (95%), sorghum (18%), soybeans (89%), and wheat (81%).
References and Data Sources
US Department of Agriculture, Economic Research Service. May 2023. Cost of Production. https://www.ers.usda.gov/data-products/commodity-costs-and-returns/
U.S. Department of Agriculture, Farm Service Agency. June 2023. ARC/PLC Program Data. https://www.fsa.usda.gov/programs-and-services/arcplc_program/arcplc-program-data/index
US Department of Agriculture, National Agricultural Statistics Service. June 2023. Quick Stats. http://quickstats.nass.U.S.da.gov/
Zulauf, C., M. Langemeier, and G. Schnitkey. 2022. U.S. Crop Profitability and Farm Safety Net Payments since 1975. Journal of the American Society of Farm Managers and Rural Appraisers. Pages 60-69. https://www.asfmra.org/resources/asfmra-journal
Zulauf, C., G. Schnitkey and N. Paulson. “Cost of Production and Farm Policy: Part I.” farmdoc daily (13):113, Department of Agricultural and Consumer Economics, University of Illinois at Urbana-Champaign, June 21, 2023.
Disclaimer: We request all readers, electronic media and others follow our citation guidelines when re-posting articles from farmdoc daily. Guidelines are available here. The farmdoc daily website falls under University of Illinois copyright and intellectual property rights. For a detailed statement, please see the University of Illinois Copyright Information and Policies here.