


Farm Bill 2023 and Policy Design: Another View of ARC-CO and PLC
Summer is officially upon us, but it has arrived in an “acrid haze” of portent with smoke descending on large swaths of the U.S. from Canadian forest fires, increasingly severe drought in the Midwest, and an expanding heat dome over Texas and the Southeast (Bosman, June 27, 2023; Drought.gov, June 23, 2023; Cappucci, June 27, 2023). Meanwhile, in Congress, the agricultural committees are attempting to reauthorize a farm bill in 2023, but with concerning portents in the aftermath of the debt limit deal (see e.g., Good, Farm Policy News, June 27, 2023; Abbott, June 27, 2023; Heslip, June 23, 2023; Douglas, June 22, 2023); Karni, June 7, 2023; Ferris, Beavers, and Carney, June 7, 2023). Continuing the review of the 2018 Farm Bill, this article adds another view of the Agriculture Risk Coverage, County Option (ARC-CO) and the Price Loss Coverage (PLC) row crop payment programs.
Background
Providing direct federal support to a subset of American farmers is the origin story of the Farm Bill, with its beginnings in the Great Depression and the New Deal policy of the Agricultural Adjustment Act of 1933. What began as an emergency response to economic crisis has persisted through vast changes in farming, as well as American society and politics. This nine-decade-long policy debate has mostly been wrapped around the price movements of a few row crops, spun by the regional politics in Congress. It began, in other words, as a regional coalition built on three crops—corn in the Midwest, cotton in the South and wheat in the Great Plains—suffering low prices in the Great Depression. In the Agriculture Act of 2014, Congress replaced the annual direct payments first authorized in 1996 with a choice between PLC and ARC, with those electing ARC choosing between ARC-CO (by covered commodity) or ARC-IC (all covered commodities) (P.L. 113-79). The 2018 Farm Bill continued this policy design in which farmers elected either ARC (CO or IC) or PLC (P.L. 115-334). The Congressional Budget Office (CBO) projects that PLC will spend $33.9 billion and the county-based option of ARC (ARC-CO) $18.3 billion over the ten fiscal years (FY) from FY2024 to FY2033; ARC’s individual option (ARC-IC) is projected to spend $623 million over that time (farmdoc daily, February 23, 2023; May 18, 2023; CBO, May 2023).
Discussion
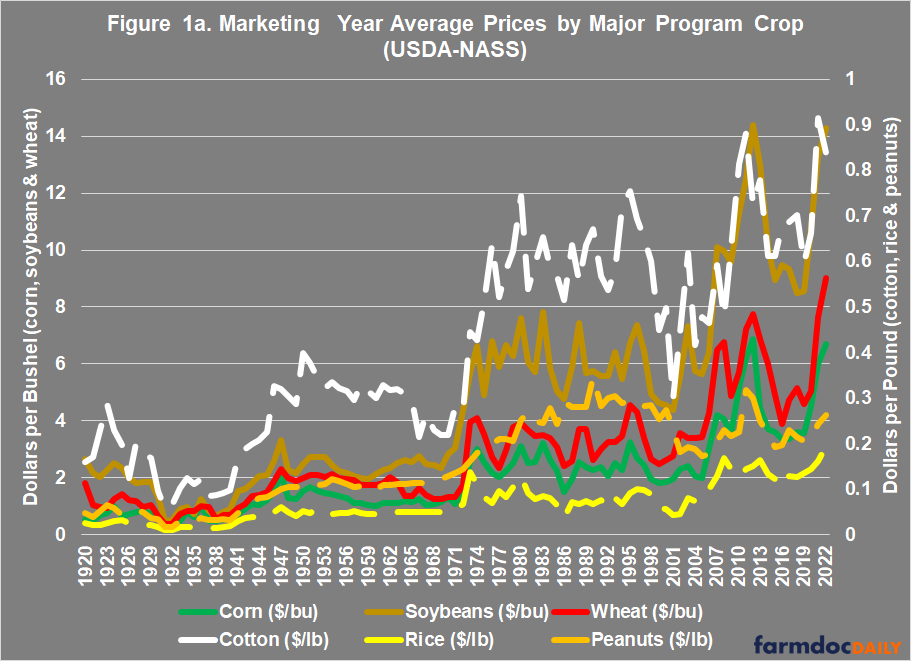
Because crop prices have been the predominant issue for federal farm policy, this discussion begins with a broad historical overview of crop prices in Figure 1a, comparing the major program crops (corn, soybeans, wheat, cotton, rice and peanuts) using data reported by the National Agricultural Statistics Service (NASS, Quickstats). Figure 1a compares the national marketing year average (MYA) prices, with corn, soybeans, and wheat in dollars per bushel, while cotton, rice and peanuts are in dollars per pound (rice converted from dollars per hundredweight). To add further context, Figure 1b calculates the national average revenue per acre for these crops since 1996 by multiplying the MYA price and the national average yield reported by NASS. The year 1996 was selected because that is when Congress decoupled farm program payments from planting decisions and production. Decoupled payments are made on base acres, which are records of previous planted acres and not the actual acres planted (7 U.S.C. §9012). Thus, a farmer can receive payment for a crop that she or he does not plant if that farm has base acres for the crop, and a farmer can plant other crops on the actual acres. Under this feature, payments are decoupled in the sense that they are not made based upon actual planting and production decisions and it is considered that payments are less likely to influence farmer planting decisions.

The figures illustrating crop prices and revenues represent the key data points for calculating PLC (MYA prices) and ARC payments (national average revenue as a proxy). PLC is the traditional fixed-price payment program. Figure 2 provides statutory excerpts for the PLC payment calculations (7 U.S.C. §9016) and relevant definitions (7 U.S.C. §9011). Payments are calculated as the difference between the effective reference price and the effective price (or MYA above the loan rate) and triggered whenever the MYA price is lower. In the 2018 Farm Bill, Congress added an escalator provision to PLC, known as the effective reference price, which is calculated as the 5-year Olympic moving average of MYA prices up to 115% of the statutory reference price. The statutory reference price remains the floor for triggering payments, it can increase (up to 115%) but cannot decrease.
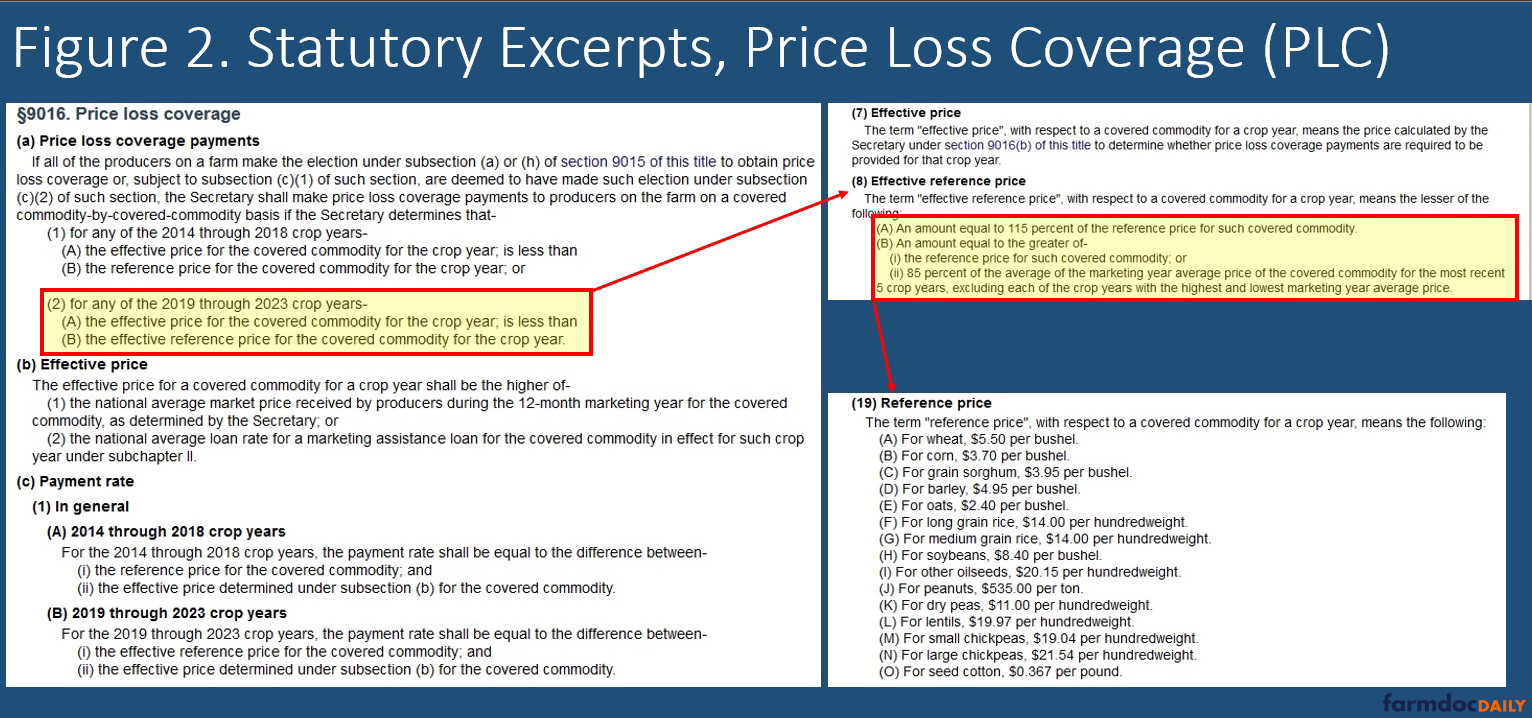
Only low prices trigger PLC payments, as defined by the statutory reference price or the temporary escalator provision. For PLC, then, the key to the program is the level at which Congress fixes the statutory reference price; the higher the statutory reference price, the more likely it will trigger payments and the larger those payments will be (see e.g., farmdoc daily, March 2, 2023). PLC payments use the payment rate (difference between effective prices and effective reference prices) with a fixed program yield for the crop (7 U.S.C. §9013). PLC payments are made on 85% of the base acres.
ARC is more complicated as it requires calculating a moving benchmark of prices and yields (revenue). Figures 3a to 3c provide statutory excerpts of the ARC calculations, highlighting the county coverage option (7 U.S.C. §9017). Payments are triggered when revenues fall below a guaranteed revenue, with a maximum of 10% of the benchmark revenue (3a). The guarantee is 86% of the benchmark, calculated as the 5-year Olympic moving average MYA and yield (3b). Finally, the actual revenue is the MYA price multiplied by the average yield in the crop year (3c). ARC-CO payments are also made on 85% of the base acres for the covered commodity, while ARC-IC payments are made on 65% of the total base acres of all covered commodities on the farm.


In addition to being more complicated, ARC is also a more flexible or responsive program. It incorporates changes in yields and after 2018 includes trend yield adjustments, as well as movements in average market prices. ARC also incorporates the effective reference price as a price floor in the ARC calculations. The program guarantee will adjust over time to either higher or lower revenues but remains driven mostly by prices. It also contains less political influence on the payments; whereas Congress fixes the statutory reference prices by crop, the moving average revenues in ARC are predominantly determined by market-based price movements and actual yield experiences.
Figure 4 provides an interactive map for ARC-CO and PLC, visualizing the average payments per enrolled base acre for the 2019 to 2021 program years. The average payments were calculated as the total payments from each program in those years divided by the average base acres enrolled in each program over those years. The data was compiled from multiple files reported publicly by USDA’s Farm Service Agency (FSA) which operates the programs (USDA-FSA, ARC/PLC Program Data). Payments are cumulative, but base acres are not cumulative. Payments are generally made on the same universe of base acres each year. In some years, farmers may enroll their crop’s base acres in ARC-CO and other years in PLC and the programs may not make payments in some years.
Regional differences in average payments are clear in Figure 4, offering another view of the general political environment for farm policy in the Farm Bill. Figures 5a and 5b add further context to the map in Figure 4 by illustrating the total payments from ARC-CO and PLC by state in the 2019 to 2021 program years, and the average base acres enrolled in the programs in those years.


Compare the leading states in Figures 5a and 5b. Iowa is the largest state in terms of base acres with nearly half (47% ARC-CO and 53% in PLC) enrolled in each program, but Iowa ranks 11th in total payments with most (83%) from PLC. Texas received the most in total payments, with 98% from PLC and ranked 5th in total base acres with most (93%) enrolled in PLC. Nationally, in program years 2019 to 2021, 87% of the nearly $8.5 billion in reported payments were from PLC; on average, 67% of the more than 243 million base acres were enrolled in PLC in those years and ARC-CO averaged $14.26 per enrolled base acre while PLC averaged $44.75 per enrolled base acre.
Concluding Thoughts
If the words of statutes determine the operation of policies and the distribution of benefits, then the Price Loss Coverage (PLC) and Agriculture Risk Coverage (ARC) programs offer straight-forward examples. Beginning with PLC, the statutory reference prices fixed by Congress directly determines payments. The higher Congress fixes the statutory reference price relative to market prices, the more often the program will make payments and the larger those payments. Establishing different reference prices results in differential treatment among program commodities, which results in farmers with base acres of different program crops experiencing different payment outcomes even if they grow the same crops. Under budget rules, moreover, programs crops with smaller base acres can afford higher reference prices because the bottom line costs (as measured against a 10-year baseline) are smaller. By comparison, the ARC program uses rolling averages and adjusts over time. The guarantee will move up after years of higher prices and then decrease over time if those prices fall over multiple years; at the same time, the guarantee can be impacted by yield losses as compared to historic trends. From payment acres to guarantee percentages and fixed reference prices, ARC and PLC present a multitude of policy design components that can be analyzed and for which alternatives could be designed that adjust payment outcomes. Given the budgetary pressures on the agriculture committees, these various features of the programs could provide opportunities for innovation and creativity that might achieve policy goals without significant CBO scoring challenges. The potential for innovation in policy design could be one among many opportunities lost to the demand for higher reference prices.
References
Abbott, Chuck. “’Early stages’ of farm bill negotiations with House, says Boozman.” The Fern’s Ag Insider. June 27, 2023. https://thefern.org/ag_insider/early-stages-of-farm-bill-negotiations-with-house-says-boozman/.
Bosman, Julie. “Smoky Air From Canadian Wildfires Blankets Midwestern Skies.” The New York Times. June 27, 2023. https://www.nytimes.com/2023/06/27/us/midwest-chicago-smoke-air-quality.html.
Cappucci, Matthew. “Extreme Texas heat wave to swell across southern, central U.S.” The Washington Post. June 27, 2023. https://www.washingtonpost.com/weather/2023/06/27/extreme-heat-texas-heatwave/.
Congressional Budget Office. “Baseline Projections: USDA Farm Programs.” May 2023. https://www.cbo.gov/system/files/2023-05/51317-2023-05-usda_0.pdf.
Coppess, J. "Budget Policy, the Updated CBO Baseline & the Debt Limit." farmdoc daily (13):91, Department of Agricultural and Consumer Economics, University of Illinois at Urbana-Champaign, May 18, 2023.
Coppess, J. "A Deeper Dive into the February 2023 CBO Baseline: Title I Commodities Programs." farmdoc daily (13):38, Department of Agricultural and Consumer Economics, University of Illinois at Urbana-Champaign, March 2, 2023.
Coppess, J. "A View of the 2023 Farm Bill from the CBO Baseline." farmdoc daily (13):33, Department of Agricultural and Consumer Economics, University of Illinois at Urbana-Champaign, February 23, 2023.
Douglas, Leah. “US lawmakers float possible farm bill extension amid delays.” Reuters.com, June 22, 2023. https://www.reuters.com/world/us/us-lawmakers-float-possible-farm-bill-extension-amid-delays-2023-06-22/.
Ferris, Sarah, Olivia Beavers, and Jordain Carney. “Conservatives shut down House floor as revenge for debt deal.” Politico.com, June 7, 2023. https://www.politico.com/news/2023/06/07/house-conservatives-choke-floor-action-as-revenge-for-debt-deal-00100785.
Heslip, Nicole. “Congresswomen Slotkin Pllans for Bipartisan Farm Bill.” Brownfield Ag News, June 23, 2023. https://brownfieldagnews.com/news/congresswomen-slotkin-plans-for-bipartisan-farm-bill/.
Karni, Annie. “House Is Paralyzed as Far-Right Rebels Continue Mutiny Against McCarthy.” The New York Times, June 7, 2023. https://www.nytimes.com/2023/06/07/us/politics/mccarthy-house-republicans-mutiny.html.
U.S. Dept. of Commerce, National Oceanic and Atmospheric Administration, National Integrated Drought System. Drought.gov, June 23, 2023. https://www.drought.gov/drought-status-updates/drought-status-update-midwest-us-2023-06-23.
Disclaimer: We request all readers, electronic media and others follow our citation guidelines when re-posting articles from farmdoc daily. Guidelines are available here. The farmdoc daily website falls under University of Illinois copyright and intellectual property rights. For a detailed statement, please see the University of Illinois Copyright Information and Policies here.