


A Historical Perspective on Illinois Farmland Sales
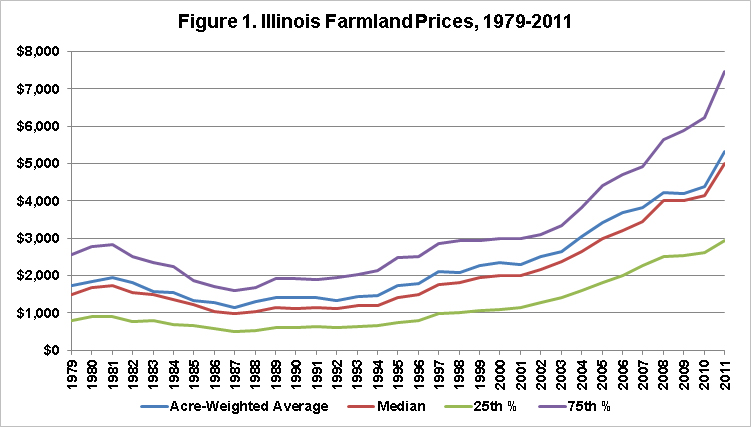
Farmland prices have soared in recent years, leading to increased interest in farmland markets and in factors affecting farmland prices. Sales records from the Illinois Department of Revenue (IDOR) allow for detailed comparisons of parcel-level information through time and for the construction of summary price trends and other descriptive statistics. In this post, we utilize detailed sales records from 1979 through 2011 for all farmland sold in Illinois, filtered for arms-length transfers of unimproved farmland parcels between 10 and 1,280 acres in size and $100 and $20,000 in per-acre sales price. In total, 97,599 sales records representing an average of 195,633 acres per year remain in this sample. On average, 2,958 parcels are represented in each year’s average. Figure 1 summarizes Illinois farmland price information through time with series for the acre-weighted average price, the median price, and the 25th and 75th percentiles of prices in each year. In contrast to the average price, which can be influenced by a few very high priced transfers that may be unrepresentative of actual farmland values, the median price is the value at which 50% of a year’s prices are above and below. The interquartile range provides a region containing the central 50% of all sales, thereby conveying the dispersion of prices. Although the interquartile range for farmland prices grows somewhat from 1979 to 2011, the increase is roughly proportional to increases in median and acre-weighted average farmland prices. In other words, there is more room for variation in farmland prices as the overall price level of farmland has increased.
To better understand the variation in sale prices within a single year, a sample of farmland sales data from 2011 is shown in Figure 2. Sales in the highest 25% of the sample in price per acre are shaded in green and sales in the lowest 25% are shaded in blue. The edges of the red-shaded data represent the quartile breakpoints. Figure 2 indicates that there is considerable variation in per-acre prices for Illinois farmland, reflecting differences among farmland quality, farmland buyers, and farmland sellers. A particularly large price range exists for small parcels, which are often purchased for nonagricultural purposes. Nonetheless, the red-shaded cluster in Figure 2 (the interquartile range) provides a meaningful measure of farmland prices that is useful for historical comparisons.

A few well-known features are apparent in Figure 1. Similarly to most other agricultural production regions, Illinois farmland prices dipped considerably during the farm crisis of the 1980s. After peaking in 1981, Illinois farmland prices declined at an annually compounded rate of 8.7 percent through 1987. After bottoming out in 1987, Illinois farmland prices increased slowly but steadily for the next decade and a half. Illinois farmland then entered a period of rapid price appreciation that has continued until today. From 2003 to 2011, Illinois farmland prices more than doubled, reflecting 9.2 percent annually compounded growth. According to USDA estimates of farm real estate values, comparably strong and long-lived growth had not occurred since the farmland boom of thirty years prior. Farmland price growth has been exceptionally robust during the past few years. In 2011, Illinois farmland prices increased 21.4 percent, the largest single-year jump in over three decades. IDOR data for 2012 are not yet fully available for certain counties and months, but preliminary estimates reveal large (approximately 15.0%) growth in Illinois farmland prices. This indication of continued strong farmland price growth agrees with both USDA farmland value data and Illinois Society of Professional Farm Managers and Rural Appraisers (ISPFMRA) data that show comparable gains in 2012.
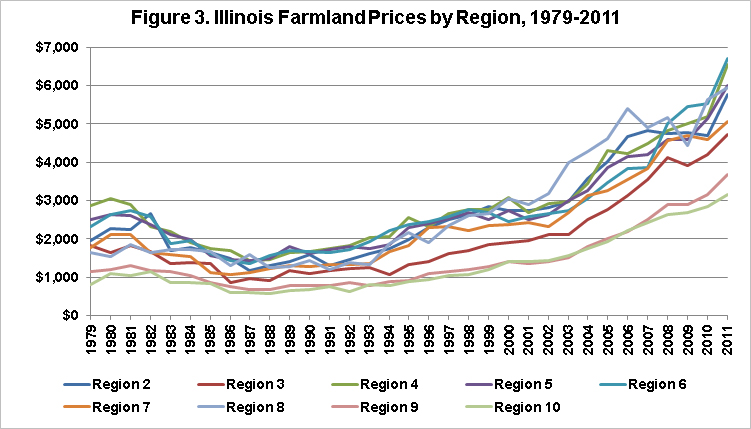
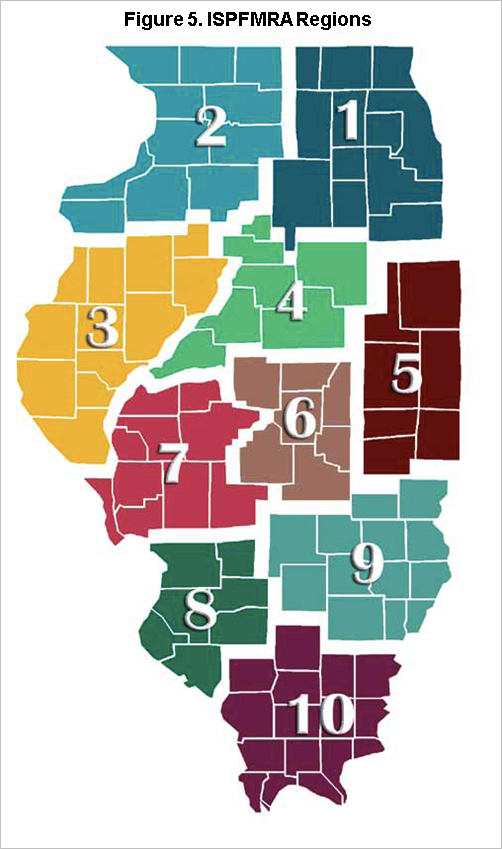
A more detailed description of Illinois farmland values is provided in Figures 3 and 4. Figures 3 and 4 report average farmland prices summarized by ISPFMRA regions (shown in Figure 5). Figure 3 displays farmland prices for nine of Illinois’ ten regions while Figure 4 represents the region containing Chicago. Price differences by region reflect differences in general productivity, and while price levels change through time, relative values remain reasonably stable. Additional premiums are present in regions near large population centers such as St. Louis.
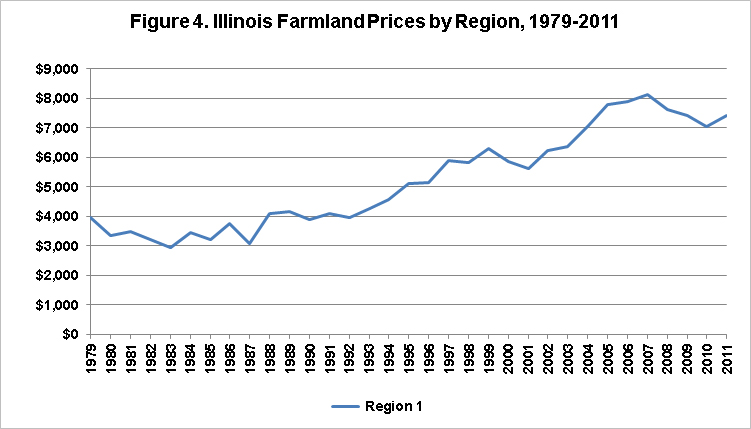
As Figure 4 shows, in both magnitude and time path, farmland prices in Region 1 are markedly different from those of other regions. Very high prices exist for farmland in Region 1 due to proximity to Chicago, which creates transitional opportunities that are unavailable in other areas. Farmland sale prices in urban-influenced areas are higher whether nonagricultural conversion is imminent or merely anticipated. Compared to other regions of Illinois, farmland prices in Region 1 have experienced relatively steady growth since 1979. It is noteworthy that the 1980s farm crisis, which depressed farmland prices in other regions, had relatively little impact on farmland prices near Chicago. However, farmland price growth in Region 1 slowed in 2005 and turned slightly negative in 2007. This downturn is attributable to diminished nonagricultural demand for farmland. Between 2005 and 2008, transitional farmland transactions (defined according to a parcel’s “current” and “intended” use) declined from 18.0 percent to 5.6 percent of the sales in Region 1. As a result, farmland prices in Region 1 fell after 2007 despite a strong farm economy that caused record farmland prices in other areas.
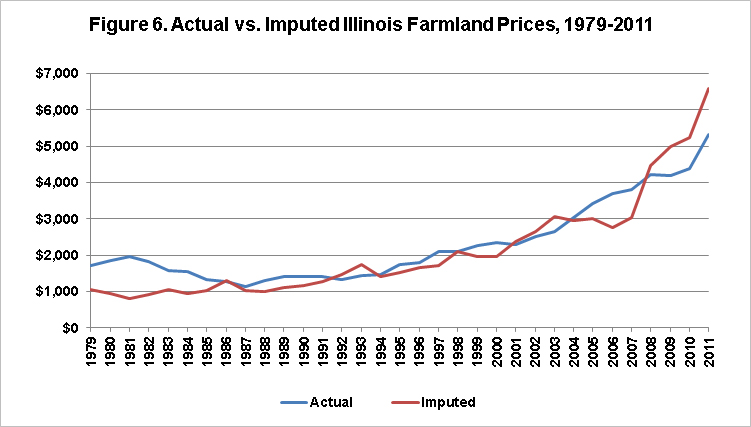
Sharp increases in farmland prices lead to questions regarding the sustainability of current farmland prices. The most basic estimate of farmland prices is provided by capitalizing income or rental values. Figure 6 displays actual Illinois farmland prices and imputed farmland prices calculated by dividing USDA cash rent estimates by 10-year constant maturity treasury interest rates. As shown, Illinois farmland prices tend to mirror capitalized cash rents fairly closely. When differences occur, they can be the result of changes in income expectations, effective capitalization rates, or market factors related to changing uses of the parcels. Plausible explanations of differences between actual and imputed farmland prices have included slow adjustment periods for cash rents, changing nonagricultural returns to farmland, or differences in true capital costs. Based on imputed farmland prices, Illinois farmland was overvalued by 58 percent in 1981, but corrected in the following years. Unlike the 1980s, the current market does not appear to be overvaluing farmland. In fact, farmland prices still have some room to “catch up” to high farm incomes and low capitalization rates. Perhaps more sensibly, the current disparity between imputed and actual farmland prices may reflect a sense that current low interest rates are not sustainable in the long-term. Overall, although Illinois farmland prices have increased to record heights at a rapid pace, they are explained well by fundamental factors.
It is apparent that the recent run-up in Illinois farmland prices has been of truly historic proportions. Although the current pairing of farm incomes and interest rates has driven farmland prices to record levels in almost all regions of Illinois, skepticism over the sustainability of these factors may be holding current farmland prices below levels predicted by capitalized rents. For better or worse, farmland prices promise to be a topic of much discussion in the foreseeable future.
Hanson is a Master’s Degree Candidate in the Dept. of Ag and Consumer Economics, and Sherrick is Marjorie and Jerry Fruin Professor of Farmland Economics and Director of the TIAA Center for Farmland Research at the University of Illinois. The views expressed herein are solely the authors’ opinions and do not necessarily reflect those of entities with whom professionally affiliated.
Disclaimer: We request all readers, electronic media and others follow our citation guidelines when re-posting articles from farmdoc daily. Guidelines are available here. The farmdoc daily website falls under University of Illinois copyright and intellectual property rights. For a detailed statement, please see the University of Illinois Copyright Information and Policies here.